
<<< Visualization Tutorials
—————————
- How to create Plotly animations
- How to save Plotly animations
- How to create Mapcharts – Plotly & Mapbox
- How to create Matplotlib animations
- How to save Matplotlib animations
- Titles, Axes, Ticks & Legend
- Matplotlib Built-in Styles
- Animated Line Charts
- Multi-line Animation
- Stacked Area Charts
- Word Cloud Visualization
- Bar Chart Animations
- Colors with Python
- Creating Multiple Charts
- Creating Hexbin Charts
- Creating Pcolor Charts
- Creating Bokeh Scatter Plot
How to Create Scatter Charts with Bokeh
Introduction
Scatter plots are fundamental chart types that can be applied to many situations across industries. In this mini Python tutorial we will create a scatter chart using Python’s Bokeh visualization library.
Before we start this Python tutorial, if you are curious WHY someone would choose Bokeh as a Python visualization library here is an article I recently published: Benefits of Bokeh over Seaborn, Plotly & Matplotlib.
1- Importing Bokeh Libraries
If you’ve created charts using matplotlib, seaborn, plotly and others, you might realize that bokeh modules work in a slightly different way. We will import many functions from different modules which can be a bit confusing at first but they work really well and harmoniously.
from bokeh.io import output_file, show
from bokeh.models import ColumnDataSource, LabelSet
from bokeh.plotting import figure
from bokeh.themes import built_in_themes
from bokeh.io import curdoc
from bokeh.layouts import column
import numpy as np
from bokeh.io import output_file, show: output_file and show are functions from the bokeh.io module that are used to save the plot to an HTML file and display the plot in the browser, respectively.
from bokeh.models import ColumnDataSource, LabelSet: ColumnDataSource and LabelSet are classes from the bokeh.models module that are used to define the data source for the plot and add labels to the data points, respectively.
from bokeh.plotting import figure: figure is a class from the bokeh.plotting module that is used to create a new plot.
from bokeh.themes import built_in_themes: built_in_themes is a dictionary from the bokeh.themes module that contains pre-defined themes that can be used to style the plot.
from bokeh.io import curdoc: curdoc is a variable from the bokeh.io module that refers to the current document or application that is running the code.
from bokeh.layouts import column: column is a function from the bokeh.layouts module that is used to arrange multiple plots vertically.
numpy is a popular numerical computing library in Python. In this code, it is used to generate random data for the scatter plot.
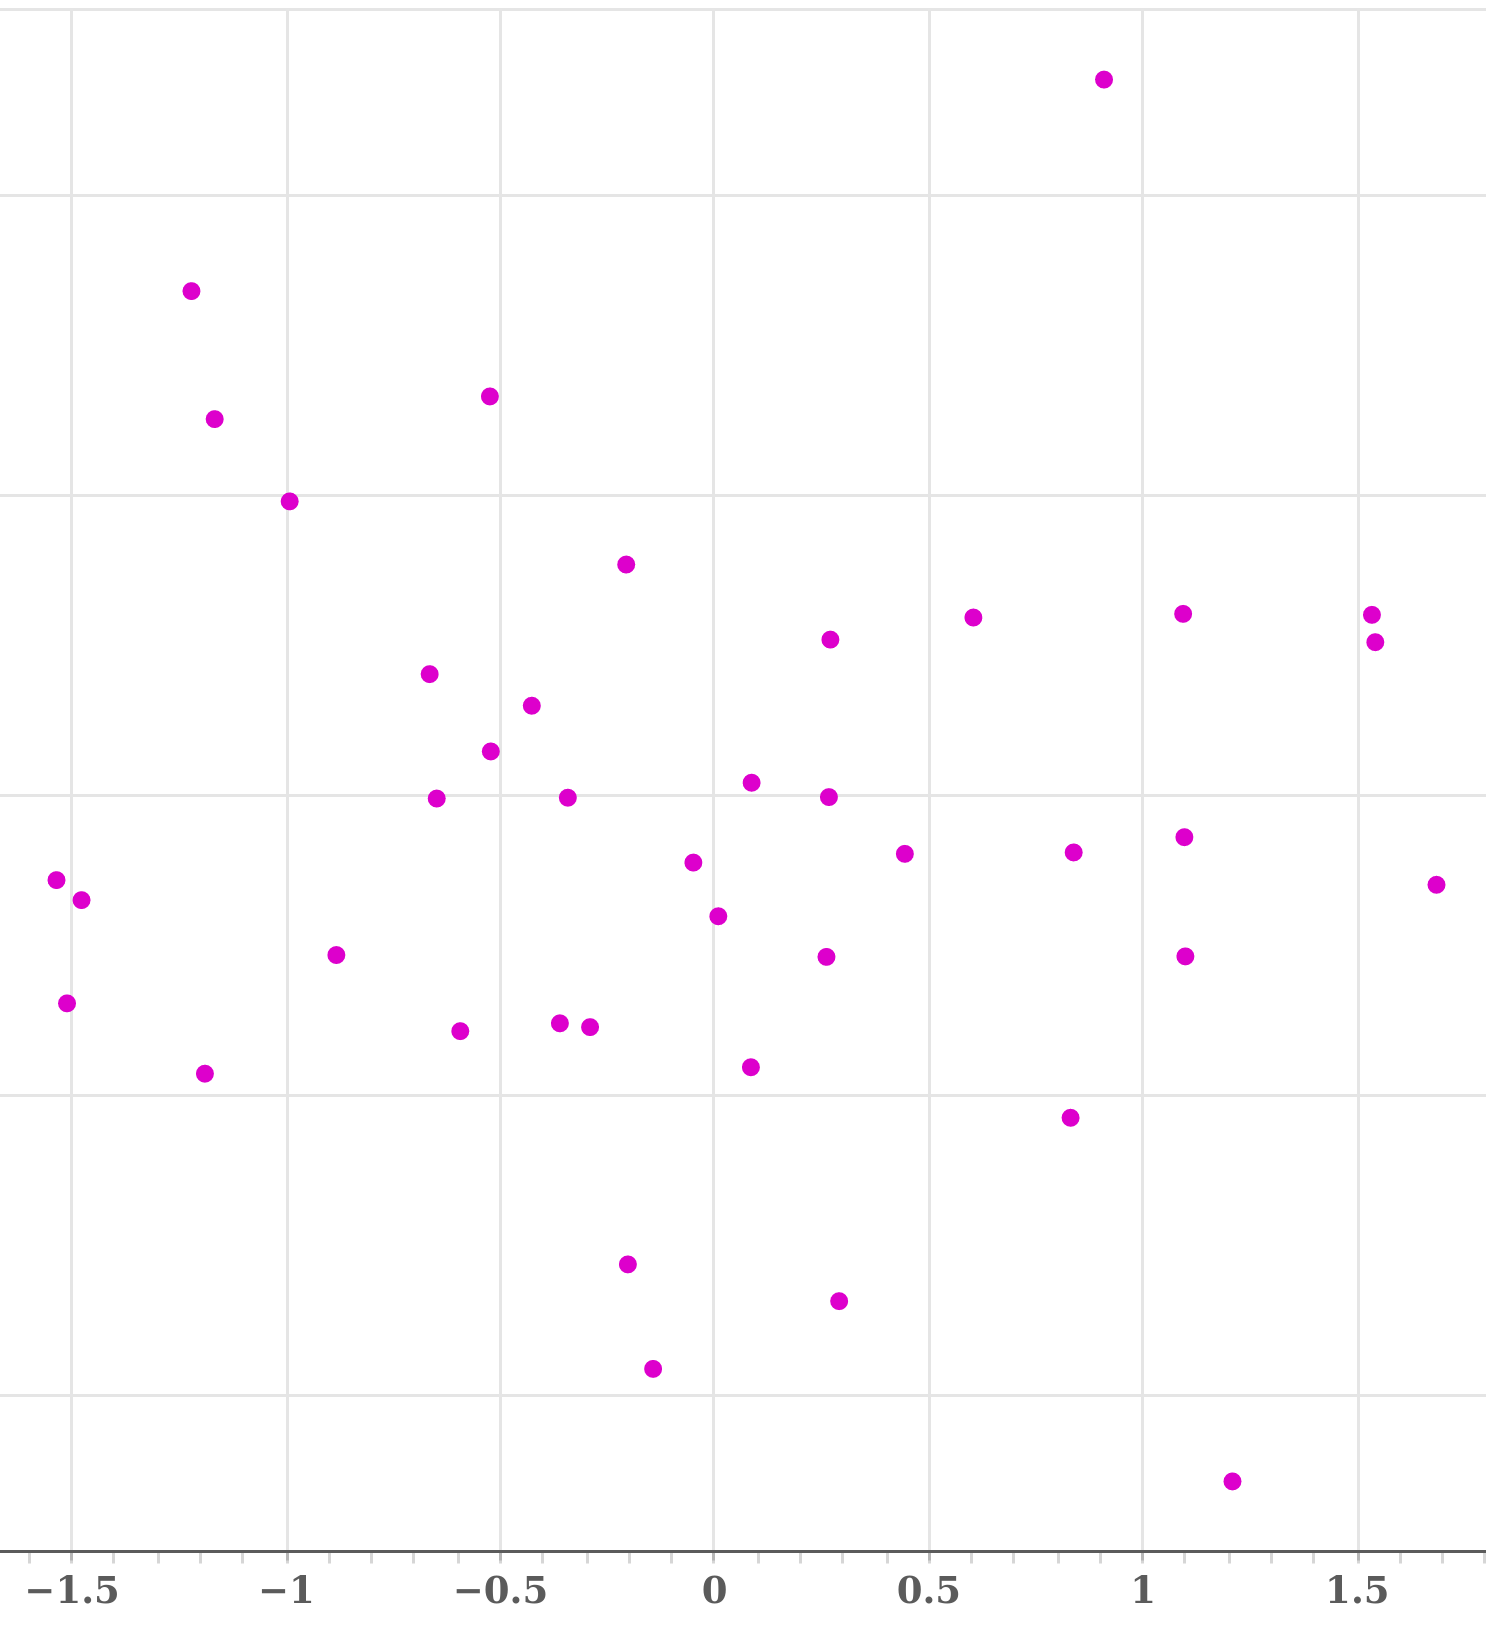
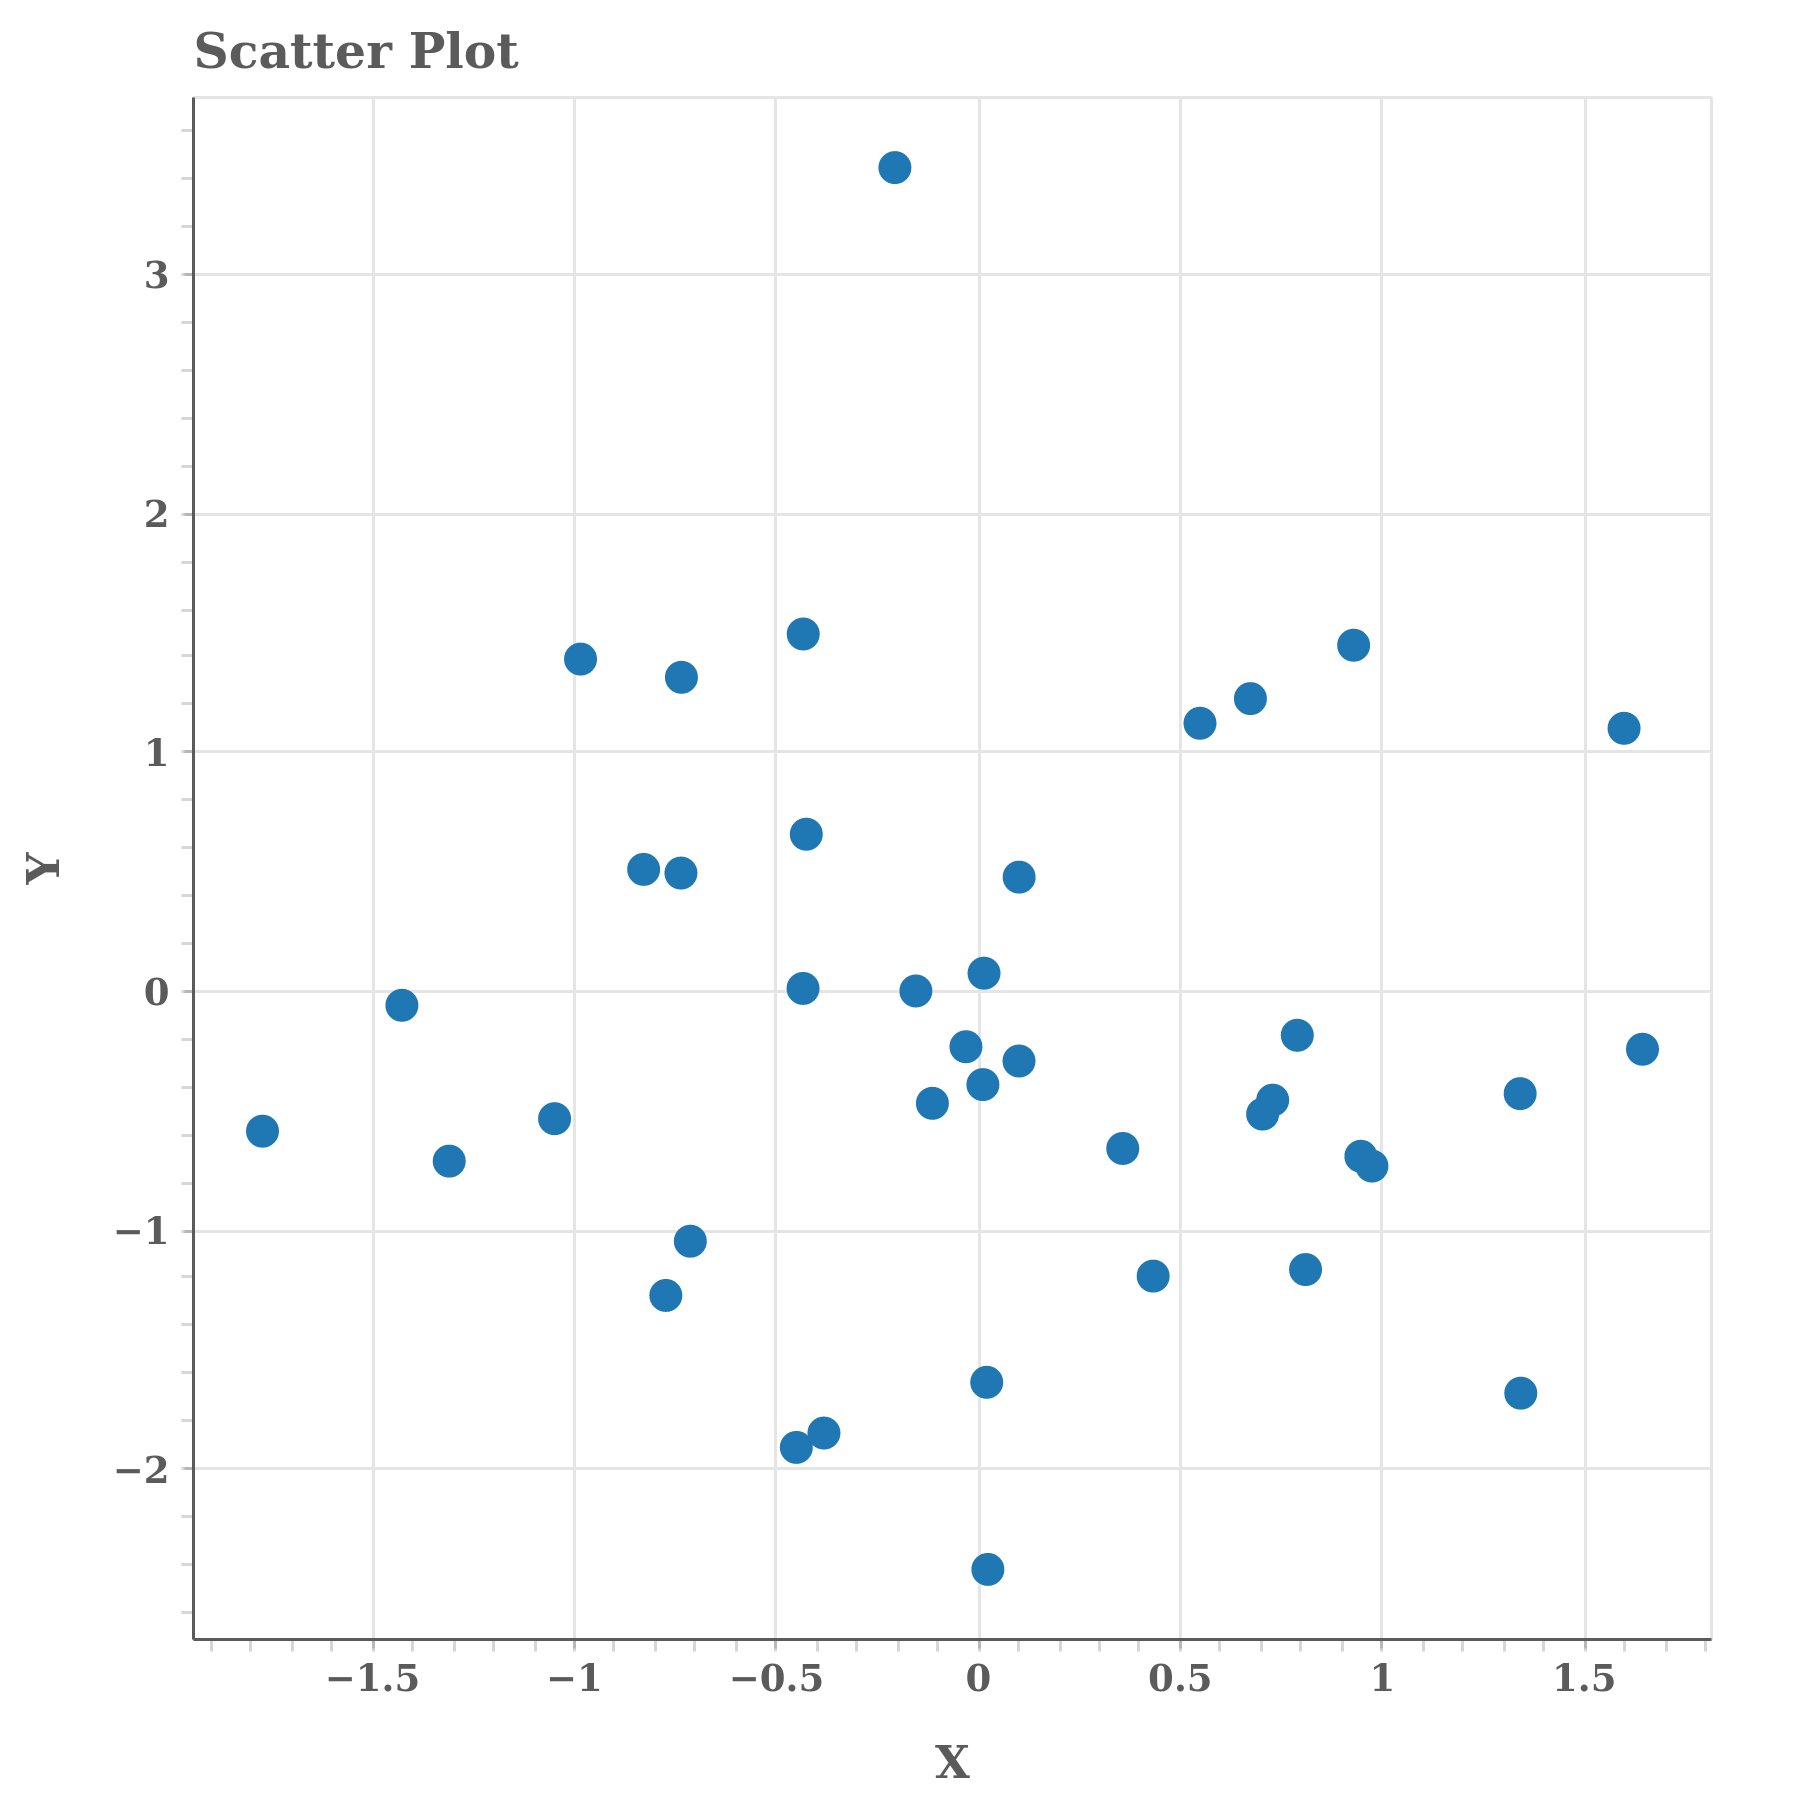
2- Example 1: Bokeh Scatter Plot with Python
Scatter chart can be created with Bokeh using figure and scatter functions. Of course, you will need x,y data points to begin with as well. Below, we will create random data points for this chart but here are the core functions for the chart generation.
# Create the figure
fig = figure(title="Random Neighbors Scatter Plot", x_axis_label="X", y_axis_label="Y")

# Add the scatter plot
fig.scatter("x", "y", source=source, size=10, color="#FFFFFF")
Saving Bokeh Charts:
Typically, Bokeh show function creates an html code and loads it locally in your web browser. To save your chart:
- You can save the page as html,
- You can view page source and copy the html code manually, or
- You can export an image by clicking on the save button on the vertical menu near the chart in browser.
Full Python Code for Bokeh Scatter Chart:
from bokeh.io import output_file, show
from bokeh.models import ColumnDataSource, LabelSet
from bokeh.plotting import figure
from bokeh.themes import built_in_themes
from bokeh.io import curdoc
from bokeh.layouts import column
import numpy as np

# Set the number of data points
n = 50

# Generate random data
x = np.random.normal(0, 1, size=n)
y = np.random.normal(0, 1, size=n)

# Create a data source
source = ColumnDataSource(data=dict(x=x, y=y, label=list(range(1, n+1))))

# Set the output file
output_file("labeled_neighbor_scatter.html")

# Create the figure
fig = figure(title="5 Random Neighbors Scatter Plot", x_axis_label="X", y_axis_label="Y")

# Add the scatter plot
fig.scatter("x", "y", source=source, size=10)

# Show the plot
show(column(fig))
3- Example 2: Bokeh Scatter Plot with Data Labels
Data labels are necessary part of visualization in many data science projects. Here we will add data labels to our chart. Let’s also utilize a theme.
Below we will implement LabelSet function to start adding labels with different size, position and values. Additionally, we will implement the Night Sky theme from Bokeh.
# Add labels to the data points
labels = LabelSet(x="x", y="y", text="label", level="glyph", source=source, text_font_size="10pt", text_color="white", x_offset=-5, y_offset=10)
fig.add_layout(labels)

# Set the theme to night sky
curdoc().theme = built_in_themes["night_sky"]

Saving Bokeh Charts:
Typically, Bokeh show function creates an html code and loads it locally in your web browser. To save your chart:
- You can save the page as html,
- You can view page source and copy the html code manually, or
- You can export an image by clicking on the save button on the vertical menu near the chart in browser.
Full Python Code for Bokeh Scatter Chart with labels:
from bokeh.io import output_file, show
from bokeh.models import ColumnDataSource, LabelSet
from bokeh.plotting import figure
from bokeh.themes import built_in_themes
from bokeh.io import curdoc
from bokeh.layouts import column
import numpy as np

# Set the number of data points
n = 50

# Generate random data
x = np.random.normal(0, 1, size=n)
y = np.random.normal(0, 1, size=n)

# Create a data source
source = ColumnDataSource(data=dict(x=x, y=y, label=list(range(1, n+1))))

# Set the output file
output_file("labeled_neighbor_scatter.html")

# Create the figure
fig = figure(title="5 Random Neighbors Scatter Plot", x_axis_label="X", y_axis_label="Y")

# Add the scatter plot
fig.scatter("x", "y", source=source, size=10, color="#FFFFFF")

# Add labels to the data points
labels = LabelSet(x="x", y="y", text="label", level="glyph", source=source, text_font_size="10pt", text_color="white", x_offset=-5, y_offset=10)
fig.add_layout(labels)

# Set the theme to night sky
curdoc().theme = built_in_themes["night_sky"]

# Show the plot
show(column(fig))
Summary
In this article, we have explored the Bokeh Python library and demonstrated a simple scatter chart with labels and the Night Sky theme.