
Matplotlib.animation package has a great class that can be used to create great live charts and animations called FuncAnimation.
We’re going to break down the main parts of creating an animation with matplotlib and then go over some of the more minor details.
You can import it using the code below:
Used Where?
- Creating animated charts and graphs. Such as:
Besides FuncAnimation class we will also use a figure and an animation function to create our animation. These are the most fundamental components of an animation created by Python and Matplotlib Visualization Library.
Let’s start with importing the necessary library and its methods:
from matplotlib.animation import FuncAnimationEstimated Time
15 mins
Skill Level
Intermediate
Key Function
FuncAnimation
Libraries
matplotlib
FuncAnimation
Once you’ve imported FuncAnimation, there are 3 major parts to creating the animation that’s important to understand.
ani = FuncAnimation(fig, func, interval)1) Figure parameter: This is the fig part of your animation.
This is the figure object that contains the plot. Either you need to create one or you can use: matplotlib.pyplot.gcf(). Which stands for “Get current figure”
2) Function parameter:
This is the func part that goes inside the FuncAnimation as a parameter. If you’d like to have a graph that animates you will need to define a function that updates the data that goes in the plot and also the function that creates the chart.
a- In your function, a chart will need to be created
b- Values that goes to the chart will need to be udpated
3) Interval parameter:
This is the part which decides the update rate of the animation in miliseconds. A value of interval=1000 will mean the animation runs the animation function and update the figure once every second.
Let’s see a simple coded designed as 4 main sections:
1) All the necessary libraries are imported
2) Figure is assigned
3) Function is defined
4) Animation is created
EXAMPLE
import random
import matplotlib
import matplotlib.pyplot as plt
from matplotlib.animation import FuncAnimation

fig = plt.figure(figsize=(15,15))


x,y = [], []
index= count()
def animate(i):
    x.append(next(index))
    y.append(random.randint(2,20))
    plt.style.use("ggplot")
    plt.plot(x,y)

ani = FuncAnimation(fig, animate, interval=300)
plt.show()
You can see a piece of code: plt.style.use("ggplot") inside the function section that refers to a style named “ggplot“.
This is a built-in style in matplotlib and currently there are 26 attractive styles like ggplot that you can easily implement for your graphs.
To see a tutorial about all of matplotlib’s built-in styles, you can click here.
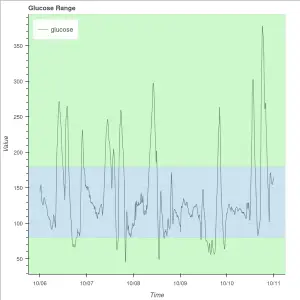
The reason why the animation above is all over the place is:
- Axes are not fixed. See: Matplotlib Axes Settings
- Line color is not defined in the animation function. See: Colors with Python
You can see a more proper line chart animation below which addresses both of these issues:
SAVING A MATPLOTLIB ANIMATION
Saving animation as a Video or GIF File:
If you’d like to learn how to save an animation as a .gif file or in video format such as .mp4, .avi or .mov, you can read this tutorial here.