
<<< Visualization Tutorials
—————————
- How to create Plotly animations
- How to save Plotly animations
- How to create Mapcharts – Plotly & Mapbox
- How to create Matplotlib animations
- How to save Matplotlib animations
- Matplotlib Built-in Styles
- Animated Line Charts
- Multi-line Animation
- Stacked Area Charts
- Word Cloud Visualization
- Bar Chart Animations
- Colors with Python
- Creating Multiple Charts
- Creating Hexbin Charts
- Creating Pcolor Charts
Colors with Python
Introduction
Color is a big component of visuals. It also caters our visual cortex which evolved after millions of years to process colors at conscious and subconscious levels.
Whether you are a web designer, scientist, consultant, financier, student or researcher colors you use make a huge impact in the outcomes of your work.
We created this color manipulation guide that goes through the usage of colormaps and hex color collections in detail.
You can add _r to any builtin colormap to get the reversed colormap as above.

1- cmap, color, color_palette
We will use a few very useful Python functions and parameters in this tutorial. Ahead of the examples let’s take a quick look at a few of them.
cmap: This parameter is available in some Python charting functions. It takes a Python Colormap and applies it to the whole graph which can be very convenient for quick and beautiful coloring results.
color: This parameter is used when a few items or a single item needs to be colored such as a title, axis label, text label, bar or scatter point. Some objects might require the usage of colors parameter instead.
color_palette: This is a great function from seaborn library. It can be used to create color palettes and individual colors from Python Colormaps. We will make examples below.
2- Color vs Colormap
Colormaps are collections of colors that are used by certain Python objects such as plotting functions to distribute a colormap to the values in the whole plot.
Individual colors are useful when coloring individual objects such as, title of a chart, a single trendline, points on a scatter plot (such as centroids), axes labels etc. Usually passed to color or colors parameters.
We have fantastic builtin colormaps that are available in matplotlib and seaborn and we can also derive specific individual colors from those colormaps. Colormaps are utilized via cmap parameter.
In this tutorial we will show a few color operations that you can use to step up your Python color game and make the really beautiful visual touch that’s needed to your design objects, Python charts and animations.
import seaborn as sns
from PIL import Image, ImageDraw

iter = 15

palette = list(reversed(sns.color_palette("Spectral_r", iter).as_hex()))
print(palette)

width_px=1000
new = Image.new(mode="RGB", size=(width_px,120))

for i in range(iter):

    newt = Image.new(mode="RGB", size=(width_px//iter,100), color=palette[i])
    new.paste(newt, (i*width_px//iter,10))
['#be254a', '#dc484c', '#ef6645', '#f88c51', '#fdb365', '#fed27f', '#feeb9d', '#fffebe',
'#f0f9a7', '#d8ef9b', '#b3e0a2', '#89d0a4', '#60bba8', '#3f97b7', '#4273b3']
new.show()
3- Available Colormaps
We have the colormaps below that are builtin and ready to use.
'Perceptually Uniform Sequential'
['viridis', 'plasma', 'inferno', 'magma', 'cividis']

('Sequential'
['Greys', 'Purples', 'Blues', 'Greens', 'Oranges', 'Reds','YlOrBr', 'YlOrRd', 'OrRd', 'PuRd', 'RdPu', 'BuPu','GnBu', 'PuBu', 'YlGnBu', 'PuBuGn', 'BuGn', 'YlGn']

'Sequential (2)
['binary', 'gist_yarg', 'gist_gray', 'gray', 'bone', 'pink','spring', 'summer', 'autumn', 'winter', 'cool', 'Wistia','hot', 'afmhot', 'gist_heat', 'copper']

'Diverging'
['PiYG', 'PRGn', 'BrBG', 'PuOr', 'RdGy', 'RdBu','RdYlBu', 'RdYlGn', 'Spectral', 'coolwarm', 'bwr', 'seismic']

'Cyclic'
['twilight', 'twilight_shifted', 'hsv'])

'Qualitative'
['Pastel1', 'Pastel2', 'Paired', 'Accent','Dark2', 'Set1', 'Set2', 'Set3','tab10', 'tab20', 'tab20b', 'tab20c']),

'Miscellaneous'
['flag', 'prism', 'ocean', 'gist_earth', 'terrain', 'gist_stern','gnuplot', 'gnuplot2', 'CMRmap', 'cubehelix', 'brg','gist_rainbow', 'rainbow', 'jet', 'turbo', 'nipy_spectral','gist_ncar']

# tt=(cm.get_cmap("viridis"))
print(type(tt))
<class 'matplotlib.colors.ListedColormap'>
These are ListedColormap objcets that you can use when the object (such as chart) can accept them, usually via cmap parameter.
4- Creating Color Palettes from Colormaps
But what’s in a color map? Can we unpack them and see what’s inside? Sure.
Using Seaborn’s color_palette() function we can unpack colormaps, generate a specific amount of color arrays and extract individual colors.
palette = sns.color_palette("Spectral")
print(palette)
[(0.8853517877739331, 0.3190311418685121, 0.29042675893886966),
(0.9873125720876587, 0.6473663975394078, 0.3642445213379469),
(0.9971549404075356, 0.9118031526336025, 0.6010765090349866),
(0.9288735101883892, 0.9715494040753557, 0.6380622837370243),
(0.6334486735870821, 0.8521337946943485, 0.6436755094194541),
(0.2800461361014994, 0.6269896193771626, 0.7024221453287197)]

We are seeing a list of tuples when we print a palette acquired via seaborn.color_palette() function.
Each tuple in this list represents an RGB color’s channels and each channel takes a floating point between 0 and 1.
We only got 6 colors but Spectral colormap actually consists of 256 colors. Let’s see a way to convert RGB colors into hex color codes and also how to slice colormaps to divide a colormap to any number of colors we want.
5- Getting Hex Codes
palette = sns.color_palette("Spectral", 10).as_hex()
print(palette)
['#d0384e', '#ee6445', '#fa9b58', '#fece7c', '#fff1a8',
'#f4faad', '#d1ed9c', '#97d5a4', '#5cb7aa', '#3682ba']
We achieved RGB to Hex conversion using as_hex() function on a seaborn color palette and specifying the amount of colors to be derived from a colormap is achieved via assigning a number to the n_colors parameter of seaborn’s color_palette function.
You can divide it to any number of colors up to 256 (or the maximum color number in a colormap). Colors will be generated evenly which can be very handy to quickly take advantage of beautiful builtin colormaps that exist in Python libraries.
For example if you choose 2 colors to be output, you will get the opposite ends of a color map, 3 colors will include a color from the middle and so on.
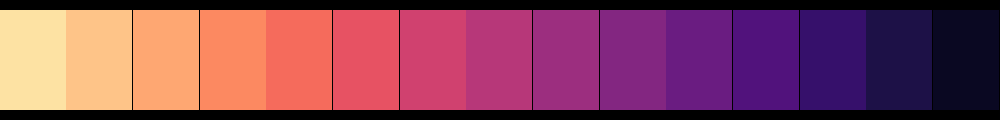
Let’s get 20 hex colors from “inferno” colormap.
palette = sns.color_palette("inferno", 20).as_hex()
print(palette)
['#07051b', '#150b37', '#280b53', '#3d0965', '#510e6c',
'#65156e', '#781c6d', '#8c2369', '#9f2a63', '#b1325a',
'#c43c4e', '#d44842', '#e25734', '#ed6925', '#f57d15',
'#fa9407', '#fcaa0f', '#fac228', '#f5d949', '#f1ef75']
These individual codes can be used to color dots, markers, titles, axes labels and many other similar objects used in Data Visualization with Python.
Additionally, you can use this color generation method in Web Development, Graphic Design or Digital Image Processing.
6- Reversing Colormaps
Every builtin colormap in Python comes with a reversed version and you can use them by calling _r added versions of colormap names. For example:
cmap=plt.cm.viridis_r
cmap=plt.cm.inferno_r
cmap=plt.cm.magma_r
cmap=plt.cm.icefire_r
cmap=plt.cm.Spectral_r
cmap=plt.cm.Reds_r
cmap=plt.cm.summer_r

You can also reverse the palettes created with Python Colormaps. This can be done using reversed function on any sequence of colors. For example:
palette = list(reversed(sns.color_palette("Spectral").as_hex()))
print(palette)
['#47a0b3', '#a2d9a4', '#edf8a3', '#fee999', '#fca55d', '#e2514a']
Color Palette Example:
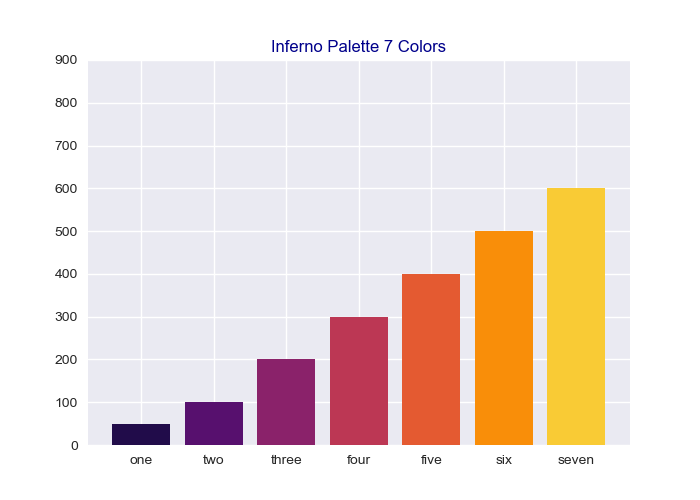
import matplotlib.pyplot as plt
import seaborn as sns

fig = plt.figure(figsize=(7,5))
axes = fig.add_subplot(1,1,1)
axes.set_ylim(0, 900)
plt.style.use("seaborn")

lst = [50,100,200,300,400,500,600]
palette = sns.color_palette("inferno", 7)
#palette = sns.color_palette("inferno_r", 7)

plt.bar(range(7), sorted(lst), color=palette)
tick_lst=["one", "two", "three", "four", "five", "six", "seven"]
plt.xticks(np.arange(7), tick_lst)
plt.title("Reversed Inferno Palette 7 Colors", color="darkblue")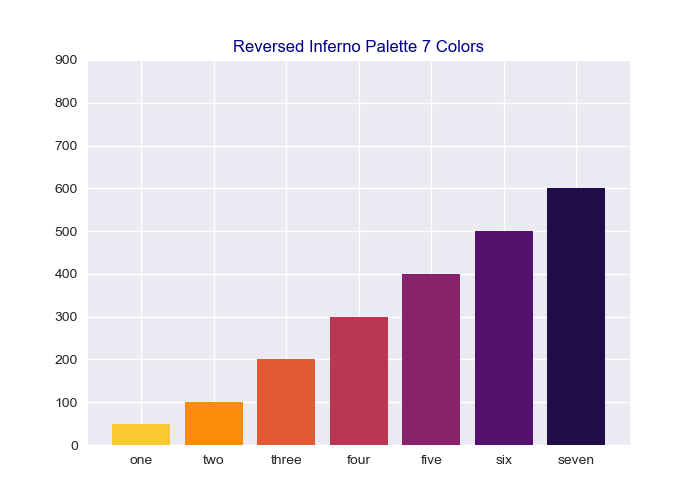
Cmap wrong use example:
Here is an example. Bar charts created with Matplotlib don’t have cmap parameter. This makes sense because bars are usually low quantity items and it wouldn’t be convenient to distribute continuous colormaps color schemes on them.
So, if you try to use cmap with a plt.bar or plt.barh object you will get an error like below:
plt.barh(range(2), [y1,y2], cmap='viridis')
AttributeError: 'Rectangle' object has no property 'cmap'
The solution is to use a discrete sequence of colors such as a palette or just a list of colors.
palette = sns.color_palette("Spectral", 9)
plt.barh(range(2), [y1,y2], color=palette)
The advantage of color palette derived from colormap is that it allows a quick and professional color set implementation from already existing schemes mentioned above.
plt.barh(range(2), [y1,y2], cmap='viridis')
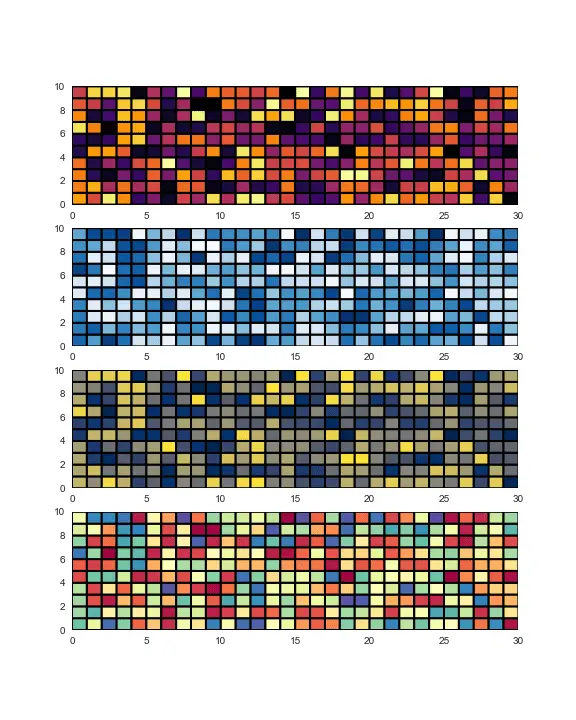
Colormap Example:
Here is a showcase of several popular Python Colormaps: viridis, cividis, inferno, reversed viridis, autumn, winter, gist_stern, twilight and gnuplot.
Do you have a favorite from the plot grid or a favorite colormap that’s excluded in the grid?

If you’d like to take advantage of creating multiple charts and create multi-plot grids of different dimensions like above you can see:
Also, this specific chart type is called Hexbin. Which can easily be created using hexbin function from pyplot. Here is a detailed tutorial:
Pcolor Example:
Another visually attractive plot type is pcolor and we can also use it to visualize colormaps to estimate what kind of results we would get from a colormap aesthetically.
You can see this tutorial about the creation of Pcolor plots.
7- Seaborn Palette vs Matplotlib Colormap
In case it’s not clear Seaborn ColorPalette and Matplotlib Colormap are different objects that can be used to do different things.
Seaborn’s ColorPalette is a versatile function that can be used to create lists of colors (Although it also has an option to return continous colormaps via as_cmap parameter).
Matplotlib’s Colormap can consist of either one of a couple of objects such as ListedColormap or LinearSegmentedColormap and it represents a continous colormap.
*That’s why we take advantage of seaborn’s versatile color_palette() function which can return lists of colors as well as a continous colormap via as_cmap=True.
Type Example: ColorPalette & Colormap
cmap=plt.cm.viridis
print(cmap)
<class 'matplotlib.colors.ListedColormap'>
palette=sns.color_palette("viridis", 100)
print(palette)
<class 'seaborn.palettes._ColorPalette'>
palette=sns.color_palette("viridis", as_cmap=True)
print(palette)
<class 'matplotlib.colors.LinearSegmentedColormap'>
See in action: Python Bar Plot Animation
8- Creating Colormaps
We have already seen how to create colormaps using Seaborn’s color_palette via as_cmap parameter. This is a very practical method to get a continuous colormap from a color palette.
You can also use Matplotlib’s ListedColormap function to create custom colormaps from lists.
ListedColormap(["darkorange", "gold", "lawngreen", "lightseagreen"])
<class 'matplotlib.colors.ListedColormap'>
9- Hex to RGB
You can also convert any Hex code to an RGB value since Hex is just a shorter representation of RGB colors. Hex consist of 6 characters and each two character represent a channel in the RGB.
For example left 2 characters represent the Red channel while middle 2 represent the Green and right 2 for Blue channel.
Using List Comprehension and a simple Lambda function, we can strip the sharp symbol from each hex in a list, create a new list and convert it to lists of RGB values.
Here is an example:
lst = ['#47a0b3', '#a2d9a4', '#edf8a3', '#fee999', '#fca55d', '#e2514a']
print(lst)
['#47a0b3', '#a2d9a4', '#edf8a3', '#fee999', '#fca55d', '#e2514a']
get_rgb= lambda x: list(int(x[i:i+2], 16) for i in (0, 2, 4))

new_lst=(map(get_rgb, lst))
print(list(new_lst))
[[71, 160, 179], [162, 217, 164], [237, 248, 163], [254, 233, 153], [252, 165, 93], [226, 81, 74]]
You can also see the usage of map function for more details.
If you have your hex codes together as a string you can also use a Python code something like below to create a list of hex codes without extra spaces or sharp symbol and then continue with the method mentioned above.
new_lst=[]
for i in lst.split(","):
    new_lst.append(i.replace('#', "").strip(" "))
Usage of Cmap
You can pass one of the builtin colormaps listed above to almost all the plotting functions in matplotlib and seaborn as one of the two ways below:
cmap Method 1:
cmap=plt.cm.viridis
cmap Method 2:
cmap="viridis"
Summary
In this Python Visualization Tutorial we have discussed colors in detail. We have seen the difference between color palettes and colormaps.
Furhtermore, we have seen how to convert RGB color codes to Hex color codes and conversion from Hex to RGB as well.
We had a few visual examples to demonstrate the use cases of color palettes as well as colormaps.
- Ex1: Color Palette Use Case with Matplotlib Bar Chart
- Ex2: Colormap Use Case with Matplotlib Hexbin Chart
Thanks for visiting.