Pcolor and Pcolormesh functions can be used to create mosaic like charts or grids that visualize data in a specific and aesthetic way.
If you have used Github, pcolor plots can look very similar to the progress grid there. In this tutorial we will demonstrate how to create and save pcolor charts.
1- Pcolor and Pcolormesh
There are 2 functions that belong to pyplot module of matplotlib that can generate very similar visuals.
Main distinction between Pcolor and Pcolormesh is that former is not suitable for large datasets while latter is (Pcolormesh). Otherwise these plotting functions will yield very similar results.
You can create hexbin charts using pyplot.hexbin function like below:
import matplotlib.pyplot as plt
import numpy as np
Z = np.random.rand(10, 30)
fig = plt.figure(figsize=(7,2))
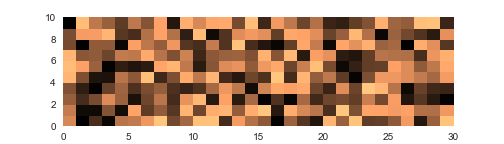
plt.pcolor(Z, cmap="copper")
Pcolor example with copper colormap
Colormaps are useful color objects in Python that can be applied to certain types of charts including pcolor. You can find out more about colormaps in the tutorial link below:
Multiple charts combinations can create powerful and efficient visuals that can be used in many types of projects including this blog page. You can check out this related tutorial if you’d like to learn more about multiple charts in Python:
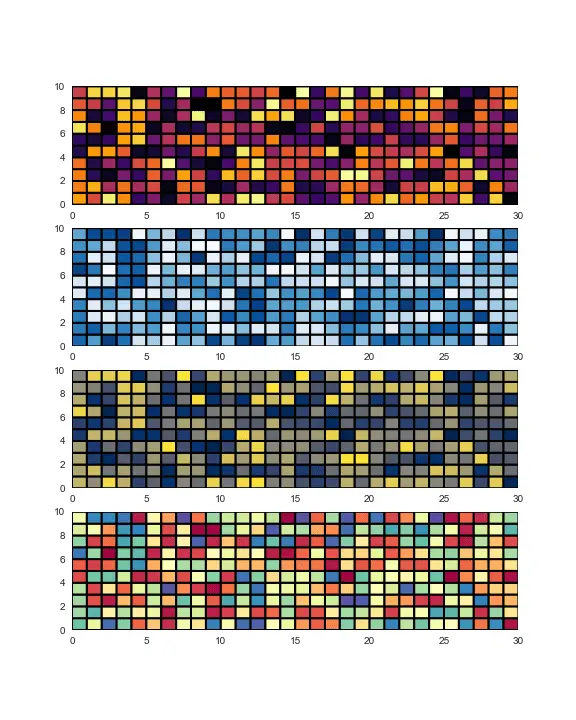
Pcolor grids with inferno, Blues, cividis and Spectral colormaps
Pcolor and pcolormesh has similar parameters that can be useful to further adjust the grid charts created with them.
Edgecolors Parameter
Edgecolors: This parameter is used to define the color of lines that separate the grids. You can also opt out of the edge option by assigning linewidths parameter explained below to 0.
Linewidths and Cmap Parameters
Linewidths is simply used to define the width of the lines between pcolor grids.
cmap can be used to apply colormaps across the chart.
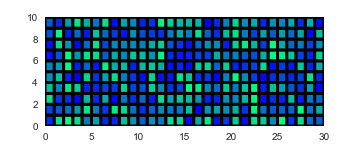
linewidths=2 & cmap="winter"
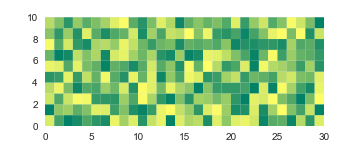
linewidths=0 & cmap="summer"
4- How to save pcolor plots
As with other Pyplot charts you can save pcolor plots using the code below. Just enter the full or relative path inside the savefig method like below:
plt.savefig("Desktop/filename.png")
Summary
In this Python Visualization Tutorial we learned how to create and save Python pcolor charts using pyplot’s pcolor function.
We learned the main parameters and settings of pcolor and demonstrated this knowledge through a couple of examples.