
This Python tutorial provides a detailed and practical step-by-step demonstration of different saving options regarding Plotly charts, plots, graphs and animations.
Check out this practical Plotly guide about creating Plotly animations if you’d like to read first about Creating Visualizations with Plotly in Python.
Used Where?
- Exploring data
- Presentations
- Business Strategy
- Scientific Research
- Financial markets
- Applications
- Websites
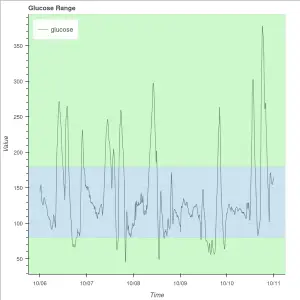
In this tutorial we will work on external data regarding Covid19 (or Coronavirus).
You can find the fully functional & interactive Plotly animation embedded at the bottom of this page for demonstration.
Estimated Time
20 mins
Skill Level
Upper-Intermediate
Exercises
na
Content Sections
Course Provider
Provided by HolyPython.com
This tutorial builds on the fig object we created in the First Part.
Here is a sneak peak to the fig object that was used to create the Plotly Express Animation:
fig = px.scatter(df, x="total_cases", y="total_deaths", animation_frame="date", animation_group="location",
            size="population", color="continent", hover_name="location",
            log_x=True, log_y=False, size_max=45, range_x=[100,10000000], range_y=[25,140000])
This tutorial will be a comprehensive guide providing lots of different online and offline methods to manage your animations, save Plotly animations as well as embedding options for websites and apps.
I will also try to address the potential glitches and errors you might encounter while saving Plotly Animations.
Plotly’s animated charts are of superb quality and have a tremendous potential for use in commercial applications, education purposes and scientific research.
If you find this work useful please consider showing this page in your references, by linking directly or sharing on social media.
Let’s start with the online possibilities.
Saving Plotly Animations: Online Methods
There are multiple sophisticated ways to save Plotly Animations. This tutorial demonstrates some of those practical solutions:
Chart Studio (chart_studio library)
Chart Studio is a very convenient and resourceful cloud service provided by Plotly. It’s quite costly for enterprise options but for small operations and individual use its free account can be very useful as well.
Let’s discover options with Chart Studio.
First all the relevant libraries can be imported like this:
import chart_studio.plotly as py
import chart_studio.tools as tls
import chart_studio
Plotly animation can be saved on the cloud with a simple 1-line code.
But you also need to identify with your credentials as below:
Also, you can get a Free Plotly Chart Studio Account from this link.
chart_studio.tools.set_credentials_file(username='holypython', api_key='Enter your API key here')

py.plot(fig, filename = 'file', auto_open=True)
PlotlyRequestError: This file is too big! Your current subscription is limited to 524.288 KB uploads. For more information, please visit: https://plotly.com/get-pricing/.
Chart Studio Embedding Option (Hosting at Chart Studio)
Now that you have your animation on the cloud you can simply get an embedding html code in i-frame format with the code below. You’re just going to have to get the link to your animation on the cloud. You can easily find it by navigating to your account and clicking the share icon.
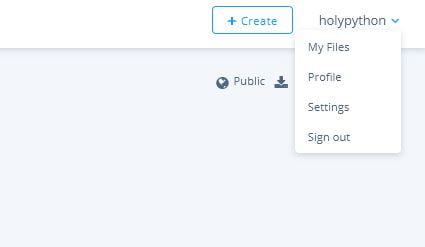
After navigating to Your Files page simply hover over your file and you will see the share button like in the image below:
1. Using get_embed to get embedding code
url='https://plotly.com/~youraccount/3/'
a=tls.get_embed(url)
print(a)
<'iframe id="igraph" style="border: none;" src="https://plotly.com/~youraccount/3.embed" width="100%" height="525" scrolling="no" seamless="seamless"><'/iframe<
2. Simply get embedding code from your Chart Studio Account Page
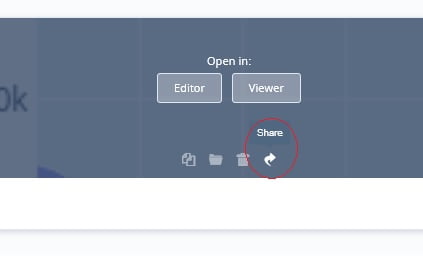
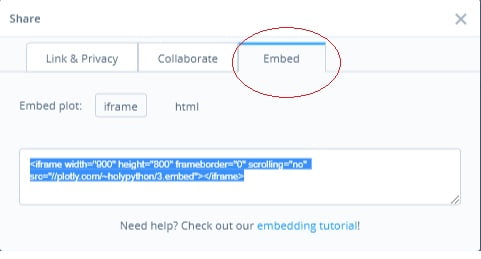
You can use iframe tag you get on your console to embed the animation on websites or apps. Alternatively, when you click on share button from your Plotly Chart Studio account there will be an embedding option that will directly give the iframe code manually.
After clicking share button on your Plotly Chart Studio Page, you can navigate to Embed tab and get the code from there as shown in the image below:
Self Hosted Embedding Options (Github or Personal Server)
This part is pretty straightforward and can be very useful. The catch is you will need space and if you have a large audience strong bandwidth privileges.
1. Self-hosted on your personal server
Simply upload your animation file to your server as html to your own website or a cloud service and replace the file location in the iframe code as below:
<iframe id="igraph" scrolling="no" style="border:none;" seamless="seamless" src=https://holypython.com/covid_cases_2020.html" height="525" width="100%"></iframe>Here is an alternative iframe tag you can use to create your own iframe by just replacing the url with yours.
Also feel free to adjust the size of the animation via width and height parameters.
<iframe width="900" height="800" frameborder="0" scrollng="no" src="https://holypython.github.io/holypython2/covid_cases.html"></iframe>2. Using 3rd party cloud and/or website services
Here are some more ideas to host your online animation file:
In Github case you can simply start a public repository, upload your file to it, commit the file and then share its link in the iframe. This method actually works pretty smoothly and reliability is not a concern at all with Github.
There can be other services available for this method just use some creativity if you need an alternative.
Saving Plotly Animations: Offline Methods
There are multiple sophisticated ways to save Plotly Animations. This tutorial demonstrates some of those practical solutions:
Various Offline saving options for Plotly Animation:
help(fig)| write_html(self, *args, **kwargs)
| Write a figure to an HTML file representation
|
| write_image(self, *args, **kwargs)
| Convert a figure to a static image and write it to a file or writeable
| object
|
| write_json(self, *args, **kwargs)
| Convert a figure to JSON and write it to a file or writeable
| object
Besides there are more options to discover, in summary:
- You can convert the animation to an html in string format
- You can convert the animation to a JSON in string format
- You can convert the animation to a JSON in dictionary format
- You can convert the animation to an ordered dictionary
 |  to_html(self, *args, **kwargs)
 |      Convert a figure to an HTML string representation.
 |
 |  to_image(self, *args, **kwargs)
 |      Convert a figure to a static image bytes string
 |
 |  to_json(self, *args, **kwargs)
 |      Convert a figure to a JSON string representation
 |
 |  to_ordered_dict(self, skip_uid=True)
 |
 |  to_plotly_json(self)
 |      Convert figure to a JSON representation as a Python dict
 |
 |  update(self, dict1=None, overwrite=False, **kwargs)
 |      Update the properties of the figure with a dict and/or with
 |      keyword arguments.
 |
 |  update_layout(self, dict1=None, overwrite=False, **kwargs)
 |      Update the properties of the figure's layout with a dict and/or with
 |      keyword arguments.
 |
 |  update_traces(self, patch=None, selector=None, row=None, col=None, secondary_y=None, overwrite=False, **kwargs)
 |      Perform a property update operation on all traces that satisfy the
 |      specified selection criteria
Besides there are more options to discover, in summary:
- You can convert the animation to an html in string format
- You can convert the animation to a JSON in string format
- You can convert the animation to a JSON in dictionary format
- You can convert the animation to an ordered dictionary
Let’s do some practical applications with some of the file writing options in Plotly.express
Saving as Html File (write_html method)
Saving the animation as an html file got to be the most straightforward option. Just execute the code below and you’ll have an offline animation file:
fig.write_html("Desktop/file.html")Alternatively you can use this code to save animations locally:
plotly.offline.plot(fig, filename=r'C:/Users/ABC/Desktop/file.html')
Saving as Json File (write_json method)
Saving the animation as an json file is equally practical with some helpful optional parameters:
fig.write_json("Desktop/file.json")With the code above, you’re going to have a raw json that’s hard to read and strange to the eye.
By throwing in the pretty parameter and assigning True boolean to it you can have an indented and structured JSON file that’s actually readable by humans and pleasant to look at:
fig.write_json("Desktop/file.json", pretty=True)Saving as Image file (write_image method)
There is an extra step involved with saving images from plotly.express library.
You will need to install orca library to facilitate the image saving with plotly and then you can save in numerous image formats such as:
- jpg
- png
- svg
Here is the error you will encounter without orca in Plotly:
fig.write_image("Desktop/file.jpg")ValueError:
The orca executable is required to export figures as static images,
but it could not be found on the system path.
Let’s get orca, it’s pretty simple.
From your Anaconda Command Prompt:
conda install -c plotly plotly-orcaYou can read more about official orca installation instructions and alternative methods here.
Now with orca it should work like a charm. Let’s try again:
fig.write_image("Desktop/file.jpg")Please note that you might need to change the file path and name. Also you might in some cases have to type the full path and use raw string format such as:
r'c://Users/ABC/Desktop/mygraph.jpg'Raw string are really useful and fix lots of path conflicts in Python.
Reducing Plotly Animation File Size (include_plotlyjs)
There is a great parameter to handle the inclusion of plotly.js source code when saving the animation or chart.
plotly.js is the source code that your plot uses for visualization when it’s opened up. It’s not a unique part of your chart, animation or plot but rather the infrastructure that facilitates how your chart or animation is displayed.
By excluding this file when saving your chart/animation you can save a great amount of space (approximately 3 MB per file).
However, if you opt to exclude this javascript source code, your animation or chart won’t be displayed in a system where plotly.js isn’t already included. To be more clear:
- if you embed the chart or animation in your website without plotly.js you still have to make sure plotly.js loads up somehow.
- if you’d like to open the html file you saved locally in your browser, it won’t work unless you also load up plotly.js separately in your browser somehow, etc.
It can still be very useful in some cases to exclude this javascript code and reduce size dramatically.
- Animation or chart will work if it’s uploaded to Chart Studio since this environment already includes plotly.js automatically.
- Multiple animations will still work if you load ployly.js once in your webpage. So you can save lots of space (file amount times 3MB) in that case.
So use cases can vary and be more broad than the ones we explain here. But, here is the parameter and code piece that would allow you to exclude the plotly.js source code:
include_plotlyjs=FalseBelow you can see the Plotly Animation, play the animation and interact with it in different ways: