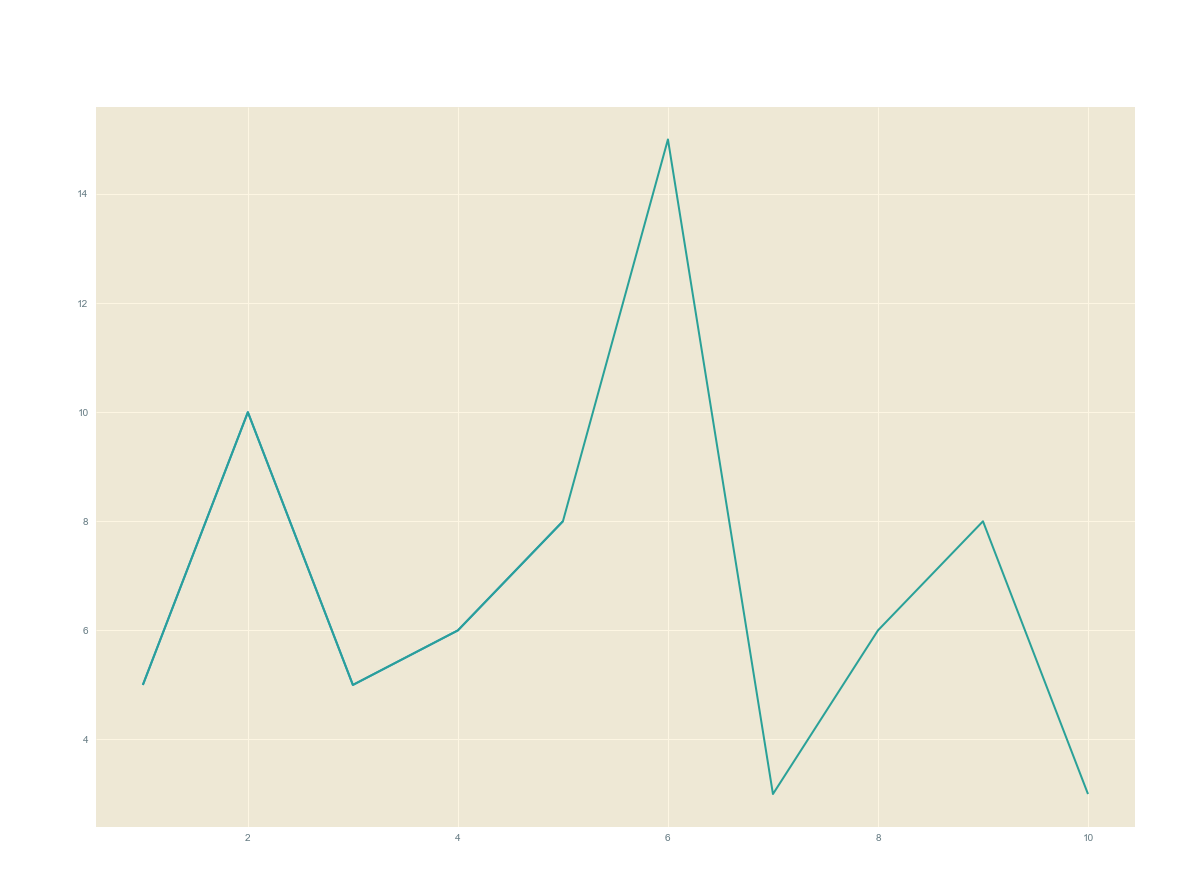
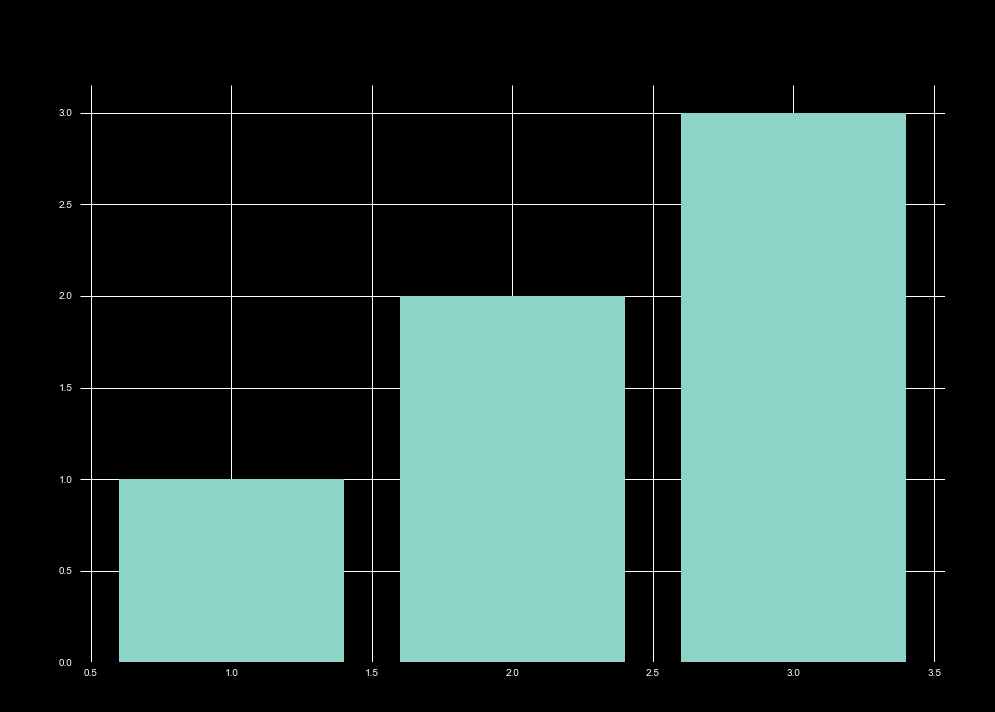
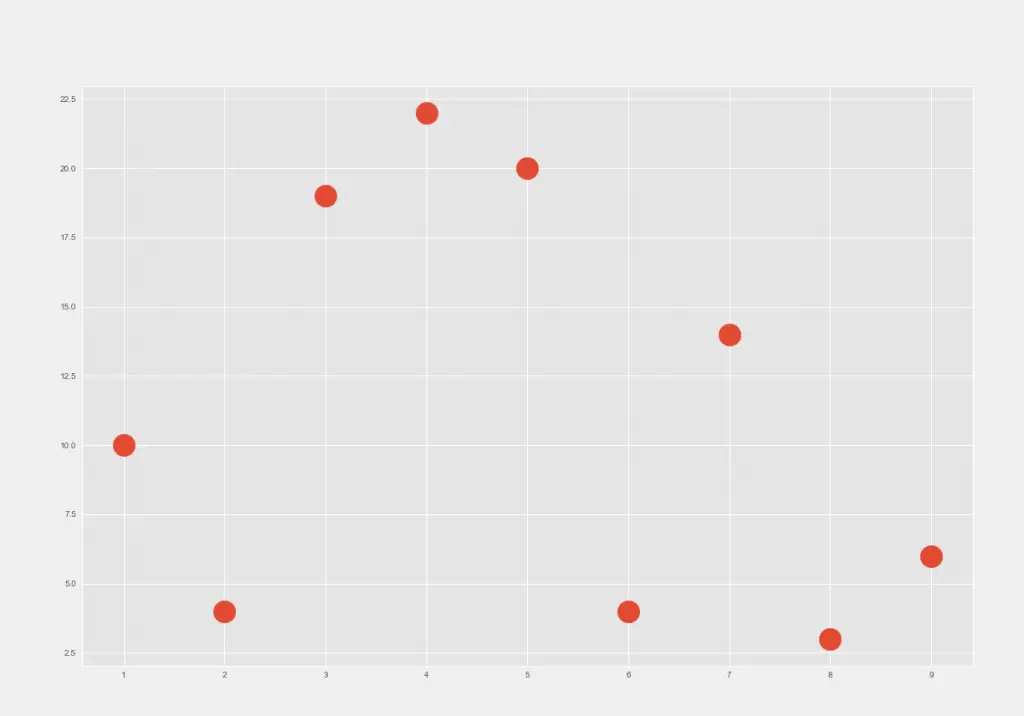
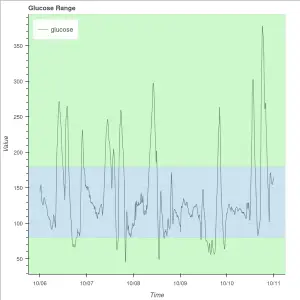
Just using a couple of lines to generate fantastic charts with your Python code is very cool. What’s even cooler is that Matplotlib library has elegant built-in styles that you can apply to your charts very easily and conveniently.

Check out the code below which shows you all the available styles in Matplotlib:

Used Where?

  • Quick styling of matplotlib graphs and charts.

Let’s start with importing the necessary library and its method and printing the available styles that it has to offer.

import matplotlib.pyplot as plt

print(plt.style.available)

Estimated Time

5 mins

Skill Level

Intermediate

Styles

25+

Libraries

matplotlib

Course Provider

Provided by HolyPython.com

Output:

bmh
classic
dark_background
fast
fivethirtyeight
ggplot
grayscale
seaborn-bright
seaborn-colorblind
seaborn-dark-palette
seaborn-dark
seaborn-darkgrid
seaborn-deep
seaborn-muted
seaborn-notebook
seaborn-paper
seaborn-pastel
seaborn-poster
seaborn-talk
seaborn-ticks
seaborn-white
seaborn-whitegrid
seaborn
Solarize_Light2
tableau-colorblind10
_classic_test

Using the Styles

Using one of the built-in styles of Matplotlib is as simple as adding a piece of code as demonstrated below: plt.style.use("")

import matplotlib.pyplot as plt

x = [1,2,3,4,5,6,7,8,9,10]
y = [5,10,5,6,8,15,3,6,8,3]

plt.style.use("Solarize_Light2")
plt.plot(x,y)
Plot with Solarize_Light2 style

dark_background Style

import matplotlib.pyplot as plt

plt.style.use("dark_background")
plt.bar([1,2,3],[1,2,3])
bar plot with dark_background style

ggplot Style

import matplotlib.animation as plt

plt.figure(figsize=(17,12))
plt.style.use("ggplot")
plt.scatter([1,2,3,4,5,6,7,8,9],[10,4,19,22,20,4,14,3,6], s=700)

plt.show()
Matplotlib Scatter with ggplot style

You can also check out Matplotlib’s official page demonstrating different built-in styles with a very elegant code here.

Recommended Posts