Debugging literally comes from de-bugging which means cleaning the bugs, flaws, errors, issues related to code and software.
Although it can be said that debugging would be best learned through real life practice of fixing errors, there are some basic knowledge and methods that can raise your awareness, save you time and make you a much more efficient debugger as well as coder.
Debugging / Testing is a huge topic in software development but as a beginner-intermediate programmer one usually needs much more primitive debugging skills and knowledge.
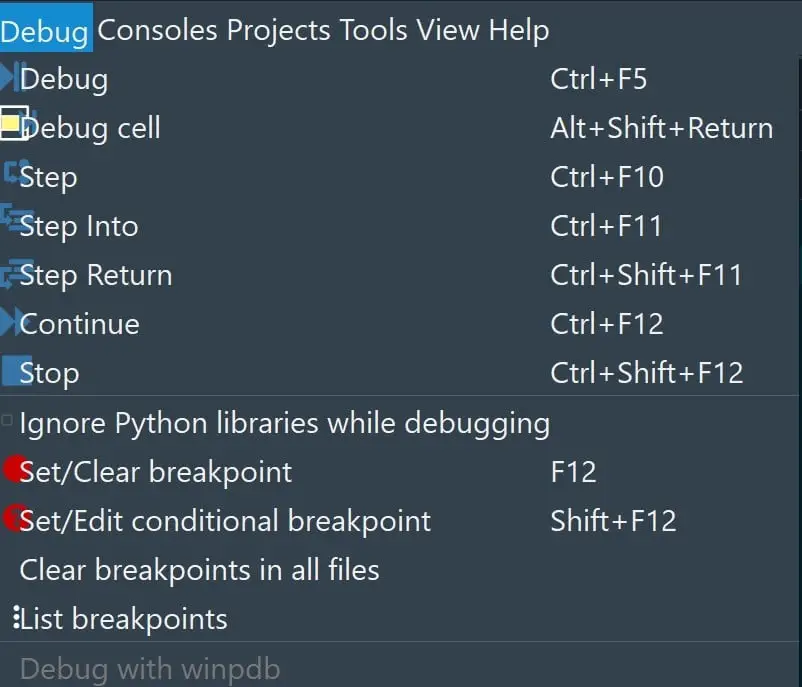
Spyder Debugging Menu
N/A
No function will be introduced in this lesson.
Used Where?
while writing code
while reusing code
while developing software
while doing data science
Syntax do(s)
1) na
Syntax don't(s)
1) na
While doing debugging there are some very practical tips and techniques that can help you:
Most compilers have sophisticated user feedback that tells you the line of the code where the error takes place. Although mostly accurate, the line of the code can be slightly misleading sometimes so that you might have to investigate +/-1 lines of your code or even a line completely somewhere else.
Python has a great list of built-in Error list that will tell you the type of the error that’s occuring. You can review our beginner lesson about the Python Error Code Types and Python Error Handling in general here.
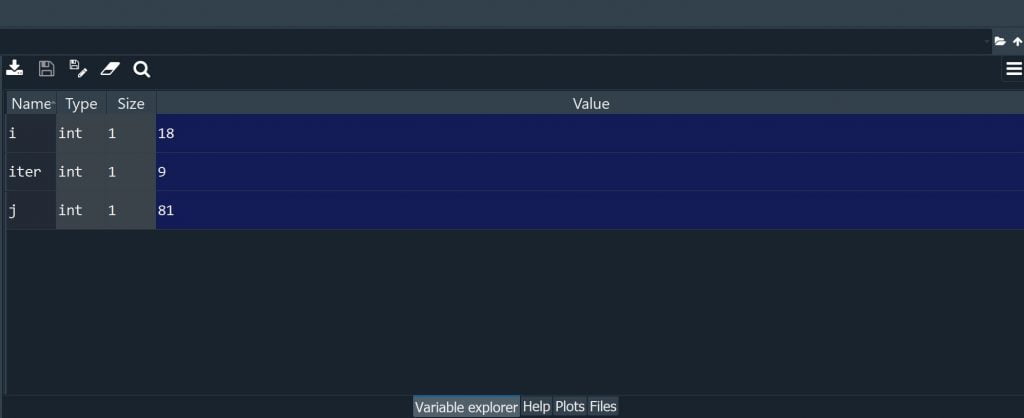
Spyder Variable Explorer
Let’s look at some of the basic debugging terminology first:
Breakpoints: Breakpoints are one of the most important debugging concepts. The logic of breakpoint debugging is very simple and intuitive, you mark a code line with breakpoint(s), then you can execute the code all the way up to that breakpoint and the execution stops at that breakpoint so you can debug the specific lines you doubt or want to look closer.
Step into: Step into will let you enter inside the specific functions in your code. If you have builtin functions or functions from other libraries and modules, step into will let you go inside them and investigate how they execute line by line during debugging.
Run current line: Runs only one line.
Run until the end: Runs the code until the end or until it returns regardless of the breakpoints.
Stop: Stop the debugging process.
Set/Clear Breakpoint: Used for setting breakpoints. Depending on the IDE it can be done simply by left clicking next to the line numbers. A red dot appears indicating the line has a set breakpoint. Clicking on it again will remove the breakpoint (Spyder). Some other IDEs might have this option in the menu that appears when you right click on a code line.
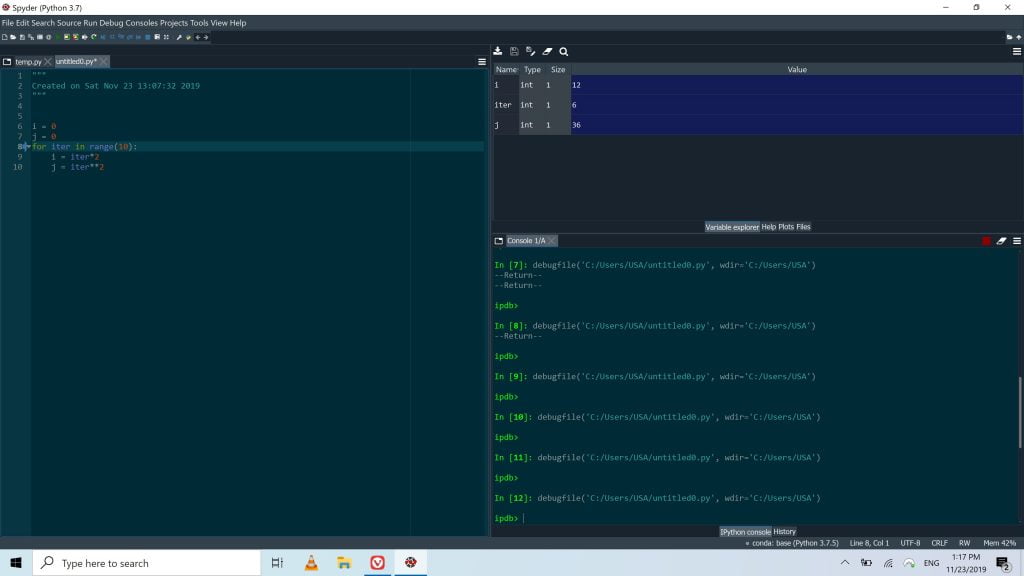
Your IDE will usually have buttons similar to these for you to carry out debugging tasks.
This is an example screenshot from Spyder IDE and here are the meanings of the buttons in order:
Start Debugging
Run Current Line
Step Into
Run until current function returns
Execute until next breakpoint
Stop Debugging
Tips
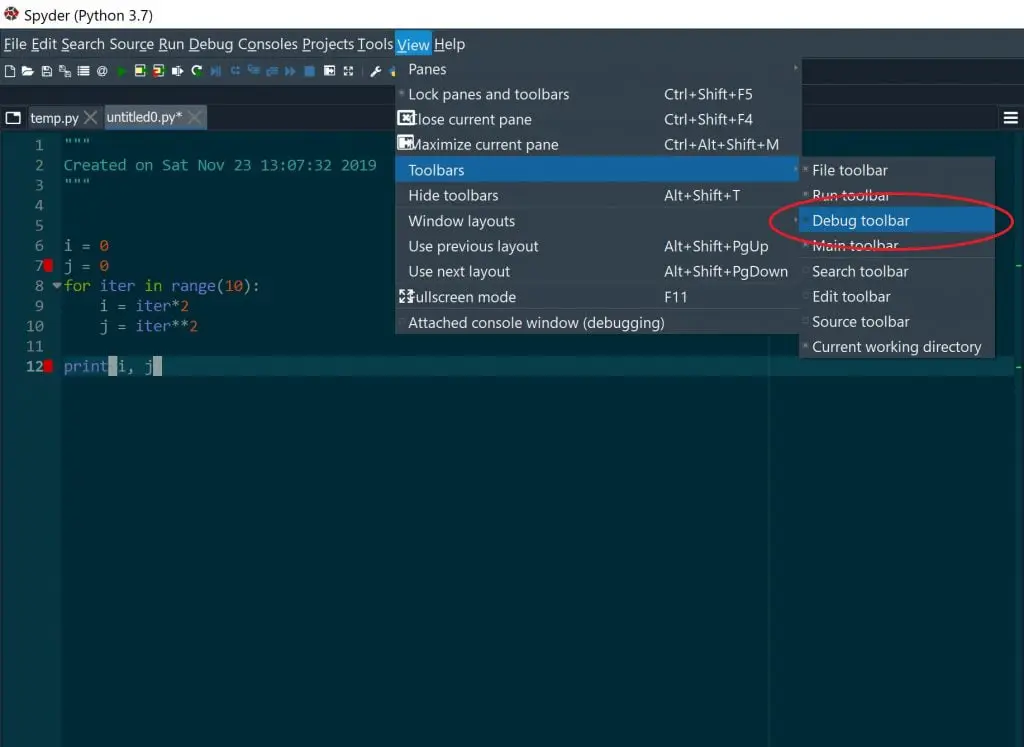
Your IDE usually has a dedicated menu for Debugging. However it can be difficult to access each debugging item through this menu each time you need them. So adding the debugging items to the toolbar so you can access them on the go during coding might be helpful.
Python IDE (Spyder) Debug Toolbar Activation
Advanced Concepts: Variable Explorer
1- Another useful component in debugging is the Variable Explorer. It will show the value or values your variables take during the execution of the code and it can be very useful to understand complex executions.
2- If you watch the Variable Explorer during a line by line debugging execution you will also get to see all the different values the variables take rather than their final value at the end of the execution.
3- You can also see if your variables don’t take any value and this by itself can be very helpful to identify an issue with the code.
Various Variables listed in Spyder's Variable Explorer